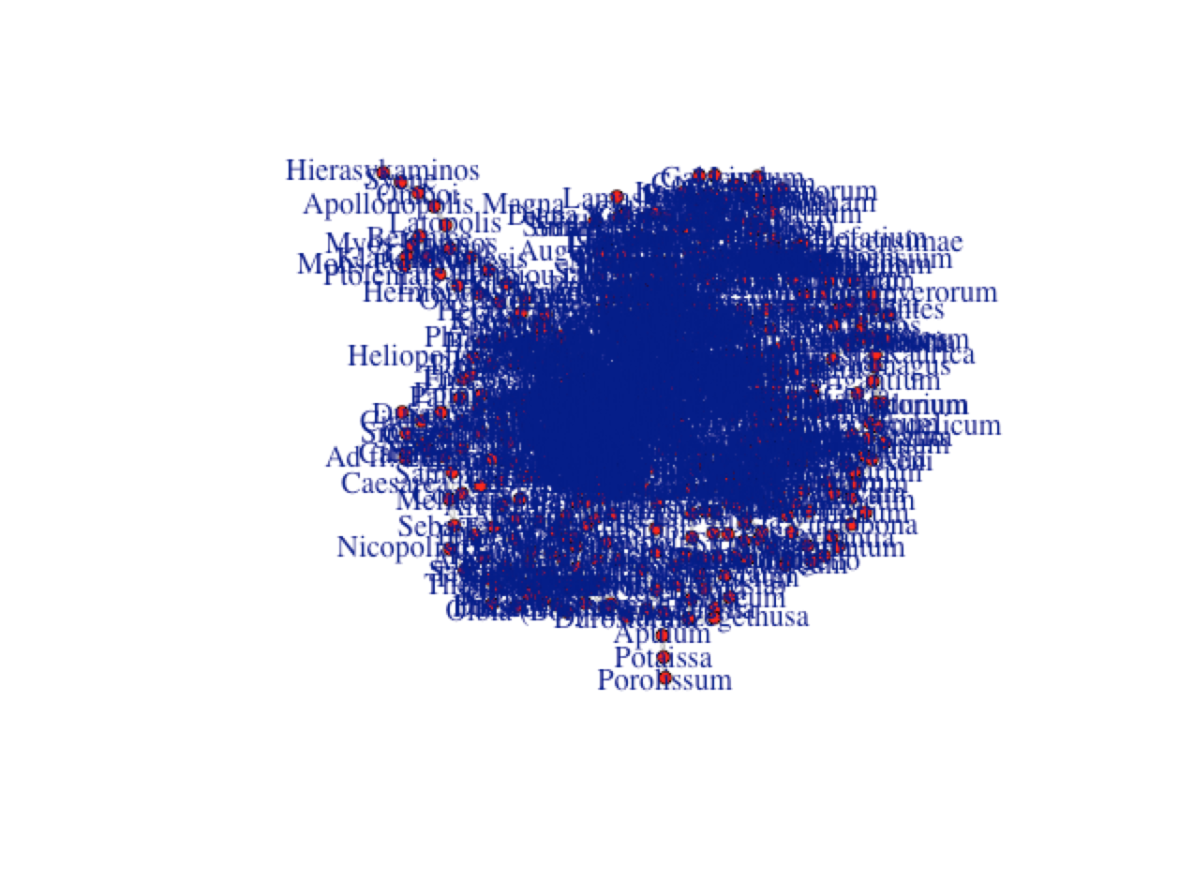
This week I tried playing around with the igraph package in R. This package helps “connect the dots” between nodes and edges — or in other words, a specific point and a path connecting between two points.
I have to admit that I did not enjoy using this package as it is not intuitive or documented very well. With the help of the Stack Overflow forum, I was able to create the plot above . However, I’m still having trouble adjusting the font size so that the plot is readable. You can view my markdown on Github since RPubs did not draw my plot.
